Buying basket analysis is a data mining technique to unlock new sales opportunities for a brand. It empowers marketers with a deeper understanding of customer purchasing patterns by analyzing large data sets of purchase trends and incidences to reveal product groupings that exhibit a high incidence of being purchased together. Acquiring transaction data is the core of all kinds of basket analysis.
The basket analysis was aided by the advent of electronic point-of-sale (POS) systems, where the digital records generated by POS systems made it easier to process and analyze large volumes of purchase data.
The basket data analysis can be performed using readily available tools (e.g., Microsoft Excel spreadsheets) to the most sophisticated Algorithmic tools (e.g., AIS, SETM, and Apriori).
The fundamental to all tools are the Association Rules that predict the products that are being purchased together and how they are related (e.g., Product A precedes the purchase of Product B but is bought together in the same shopping incidence).
The very purpose of the basket insights warrants primarily two types of analysis:
- Predictive analysis that discloses the items that are purchased in sequence and the influence of the other brands while purchasing a particular brand – thus providing opportunities for cross-selling or even upselling.
- Differential analysis that explores data across stores, customer groups, dayparts, and seasonality. The purpose is to understand which parameters explain the incidences of purchases of certain items in one basket vs. which parameters don’t explain such incidences. These insights can lead to identifying opportunities for plugging in new product offers that drive higher sales.

Basket analysis can help all the stakeholders in many ways.
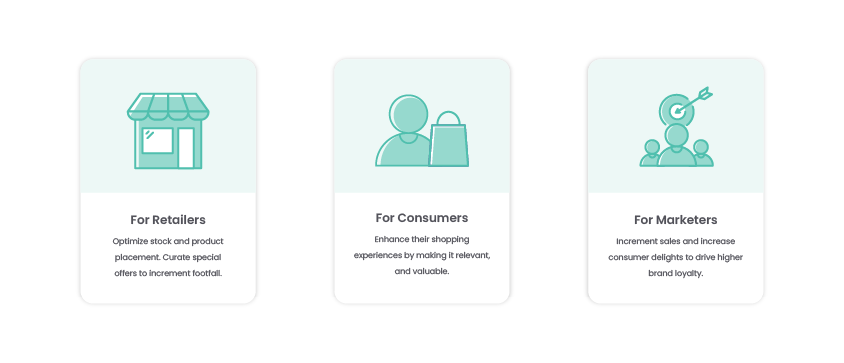
- Based on Basket analysis (products that are often purchased together), Retailers can optimize stock and product placement and help them initiate special deals and bundle offers to drive incremental footfalls and sales at the stores.
- Such programs enhance and improve the shopping experiences for Consumers by making them more productive, relevant, and valuable. Thus it gives more reasons to buy from a particular store chain more often.
- Apart from driving incremental sales, Marketers can foster higher purchase momentum for the slow-moving SKUs, intensify consumer delights, and drive higher loyalty toward the brand and the company.
- Retailers’ perspectives: Retailers are facing huge pressures owing to the rapid growth of eCommerce, particularly bigwigs like Amazon and Walmart Inc. Retailers gain insights from basket analysis on retail market size, current retail market trends, quantity, and consumer segments based on their basket values. These insights enable the retailer to formulate dynamic pricing, promotion, and SKU display strategy to sustain and improve footfalls and revenues. It also helps them to build a preemptive strategy to gain a competitive edge at both offline and online stores.
- Enterprises’ perspectives: As already mentioned the main driver of basket analysis is to understand consumers’ changing preferences towards a specific product category, the brands within the category, and the competitive standing and its relative impact on one another. The sales and marketing teams, with these invaluable insights, can develop more effective product placement, pricing, cross-sell, and up-sell strategies that lead to overall business growth for the company.

When a brand’s advert sends leads to a retailer’s site to check out, consumers may view or buy multiple products, including the advertised brand. Such phenomena provide category linkage insights to the brand owners about their brands while they are bought by the consumers. Such multi-product purchases are attributable to the brand’s campaign as long as at least one product from that brand is included in the basket at the time of purchase.
The brand partners /agencies can view and download basket insights reporting in Collaborative ads product-level reporting via their Business Manager.
A. For Advertisers (Brand owners)
- Understanding of what else people are buying along with their products after seeing their ads
- Provides additional buyer behavior insight on companion purchase categories
- Unlock deeper insights to use for marketing and ad strategies
- Provide insights for the products and categories in the catalog segments shared by the Collaborative ads retail partner with its brand partners.
B. For Retailers
- Help strengthen relationships with brand partners by enhancing the value of Collaborative ads partnerships.
- Gain higher value from the brand partners by becoming a source of purchase data and insights
- Create an opportunity to get monetary value by providing consumer purchase behavior insights to brand owners
Share of baskets- The critical quotient of Basket insight
Basket insights exhibit the product categories that are bought along with the brand’s products. This is presented as a percentage of total purchased baskets that contain at least one of the brand’s products.
Share of baskets calculation:
Definition:
The number of baskets in which category “X” (e.g. Cosmetics) was purchased along with the brand’s product “Y” (e.g. Y Moisturising Lotion).
This is divided by the total number of baskets in which the brand’s product (Y Moisturising Lotion) was bought:
An Example:
Baskets with products from the category Cosmetics + Y Moisturising Lotion =50
Total baskets with Y Moisturising Lotion = 200
50/200 = 0.25 or 25%
25% represents the share of the total brand baskets that had Cosmetics + Y Moisturising Lotion
Retailers could enable Collaborative ads options for their brand partners subject to:
- All products in the catalogs have category names specified in the category field using simple alphanumeric language to make basket insights report easy to comprehend
- Each catalog contains a unique number of categories ranging between 5 and 1000
- Category info is entered in the google_product_category field.
-
Selection of Partner in Collaboration Centre
-
Selection of the “Premium” option
-
Turning on the “Basket Insights” menu
-
Selection of “the shared catalog segments.”

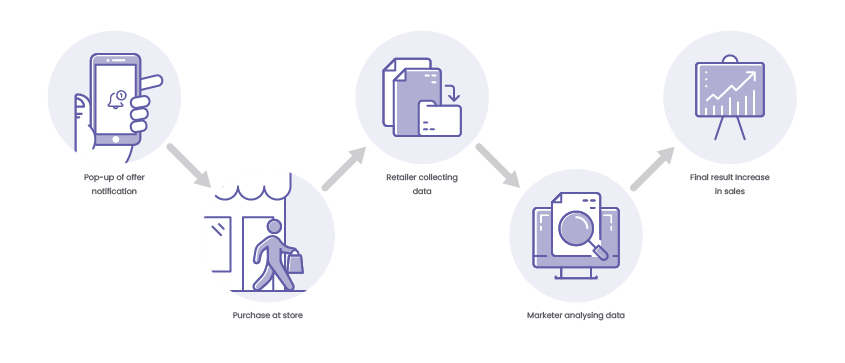
With a tailor-made purchase journey aimed to curate a relevant and convenient buying opportunity for a hyper-targeted consumer segment, Grivy enables the end-to-end journey to fulfill your strategic missions by acquiring, activating, and incorporating basket insights with seamless integration of touch-points from point-of-interest to point-of-sales unveiling the data story of each customer transaction.


